|
#2
July 10th, 2016, 12:10 PM
| |||
| |||
| Re: Data Interpretation For CAT Exam
As you asking here I am providing Practice paper with the solved Data Interpretation and Logical reasoning section Directions (1-5): Read the following pie-chart for the year 1998 and answer the questions given below it. 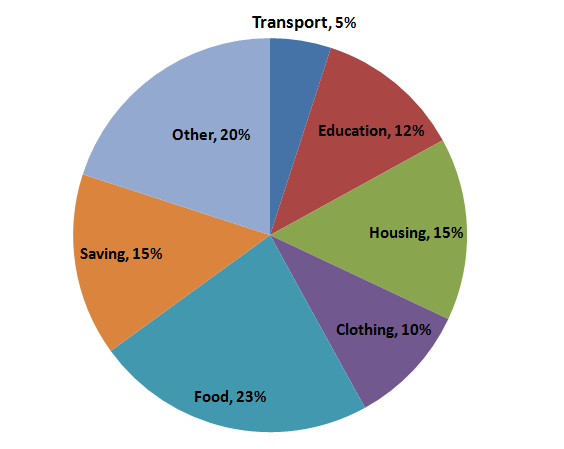 Question 1: If the total amount spent during the year 1998 was Rs.46000, the amount spent on food, was: (a) Rs.2000 (b) Rs.10580 (c) Rs.23000 (d) Rs.2300 Question 2: If the total amount spent was Rs.46000, how much was spent on clothing and housing together? (a) Rs.11500 (b) Rs.11050 (c) Rs.10000 (d) Rs.15000 Question 3: The ratio of the total amount of money spent on housing to that spent on education was: (a) 5: 2 (b) 2: 5 (c) 4: 5 (d) 5: 4 Question 4: The given pie-chart shows that the maximum amount was spent on: (a) Food (b) Housing (c) Clothing (d) Others Question 5: If the total expenditure of the family for the year 1998 was Rs.46000, the amount the family saved during the year is: (a) Rs.1500 (b) Rs.15000 (c) Rs.6900 (d) Rs.3065 Answers and Explanations Answer 1: b The total amount spent = Rs 46000 The amount spent on food was =23% of 46000 = (23/100) x 46000 = Rs. 10580 Hence, the correct option is (b). Answer 2: a The total amount spent = Rs 46000 Total share of clothing and housing = 10% + 15% = 25% The total amount spent on clothing and housing = Rs. 25% of 46000 = (25/100) x 46000= Rs. 11500 Hence, the correct option is (a). Answer 3: d The data is given as a pie chart. So to calculate the ratio of the amount spent, we do not need the actual amount spent as it will be cancelled out in the final calculations. The amount spent on housing is 15% and on education is 12% of the total. Hence, the required ratio is 15: 12 = 5: 4. The correct option is (d) Answer 4: a The sector which has the maximum percentage share in the pie chart showcases maximum amount spent. According to the graph, the maximum amount was spent on food which was 23% of the total expenditure. The correct option is (a). Answer 5: c The total amount spent = Rs 46000 Savings of the family = 15 % of 46000 = (15/100) x 46000 The correct option is (c). |