|
#1
September 22nd, 2016, 12:32 PM
| |||
| |||
| ONGC Quarterly Results
Hello sir, I’m a share holder of ONGC and want to know the ONGC Quarterly Results? Is there any one can provide me here quarterly data result of ONGC? The company reported a stellar performance for last financial year with Rs 13,120, 7 crore total consolidated revenue for the 12 months ending on March 31, 2016 ONGC Audited Financial Results for Financial Year Ended 31st March 2016: 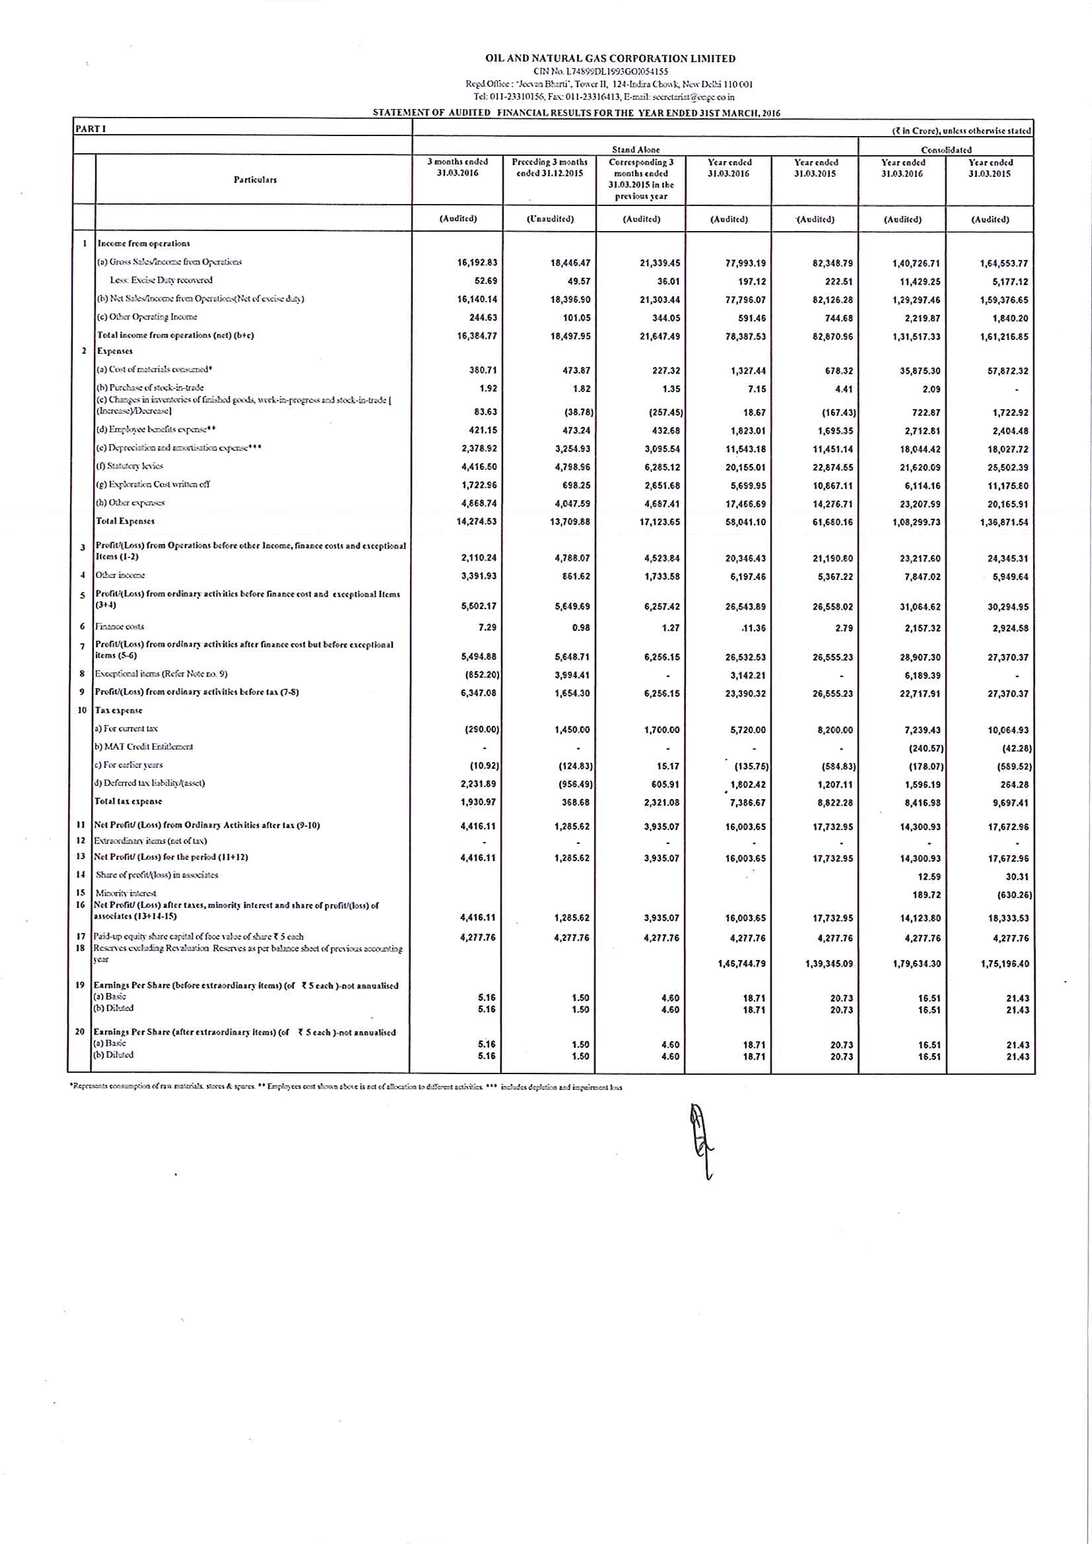      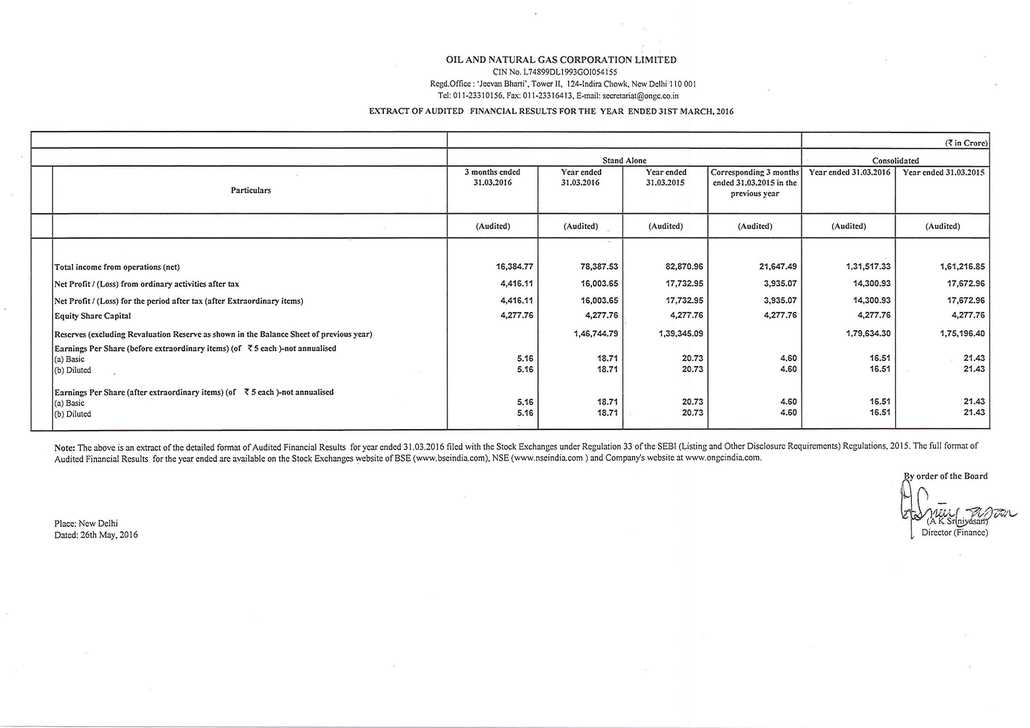 Quarterly Results of Oil and Natural Gas Corporation: Mar '16 Dec '15 Sep '15 Jun '15 Mar '15 Net Sales/Income from operations 16,140.14 18,396.90 20,563.19 22,695.84 21,303.44 Other Operating Income 244.63 101.05 116.37 129.41 344.05 Total Income From Operations 16,384.77 18,497.95 20,679.56 22,825.25 21,647.49 EXPENDITURE Consumption of Raw Materials 380.71 473.87 326.60 146.26 227.32 Purchase of Traded Goods 1.92 1.82 1.61 1.80 1.35 Increase/Decrease in Stocks 83.63 -38.78 102.30 -128.48 -257.45 Power & Fuel -- -- -- -- -- Employees Cost 421.15 473.24 452.95 475.67 432.68 Depreciation 2,378.92 3,254.93 2,874.37 3,034.96 3,095.54 Other Expenses 11,008.20 9,544.80 11,021.41 11,747.24 13,624.21 P/L Before Other Inc. , Int., Excpt. Items & Tax 2,110.24 4,788.07 5,900.32 7,547.80 4,523.84 Other Income 3,391.93 861.62 1,137.70 806.21 1,733.58 P/L Before Int., Excpt. Items & Tax 5,502.17 5,649.69 7,038.02 8,354.01 6,257.42 Interest 7.29 0.98 0.01 3.08 1.27 P/L Before Exceptional Items & Tax 5,494.88 5,648.71 7,038.01 8,350.93 6,256.15 Exceptional Items 852.20 -3,994.41 -- -- -- P/L Before Tax 6,347.08 1,654.30 7,038.01 8,350.93 6,256.15 Tax 1,941.89 493.51 2,195.99 2,891.03 2,305.91 P/L After Tax from Ordinary Activities 4,405.19 1,160.79 4,842.02 5,459.90 3,950.24 Prior Year Adjustments 10.92 124.83 -- -- -15.17 Extra Ordinary Items -- -- -- -- -- Net Profit/(Loss) For the Period 4,416.11 1,285.62 4,842.02 5,459.90 3,935.07 Equity Share Capital 4,277.76 4,277.76 4,277.76 4,277.76 4,277.76 Reserves Excluding Revaluation Reserves -- -- -- -- -- Equity Dividend Rate (%) -- -- -- -- -- EPS Before Extra Ordinary Basic EPS 5.16 1.50 5.66 6.38 4.60 Diluted EPS 5.16 1.50 5.66 6.38 4.60 EPS After Extra Ordinary Basic EPS 5.16 1.50 5.66 6.38 4.60 Diluted EPS 5.16 1.50 5.66 6.38 4.60 Public Share Holding No Of Shares (Crores) -- -- 265.78 265.78 265.77 Share Holding (%) -- -- 31.07 31.07 31.06 Promoters and Promoter Group Shareholding a) Pledged/Encumbered Number of shares (Crores) -- -- -- -- -- Per. of shares (as a % of the total sh. of prom. and promoter group) -- -- -- -- -- Per. of shares (as a % of the total Share Cap. of the company) -- -- -- -- -- b) Non-encumbered Number of shares (Crores) -- -- 589.77 589.77 589.78 Per. of shares (as a % of the total sh. of prom. and promoter group) -- -- 100.00 100.00 100.00 Per. of shares (as a % of the total Share Cap. of the company) -- -- 68.93 68.93 68.94 Last edited by Neelurk; May 27th, 2020 at 03:30 PM. |