|
#2
March 21st, 2017, 04:04 PM
| |||
| |||
| Re: Technical Analysis Union Bank Of India
Union Bank of India is one of the largest government-owned banks of India. It is listed on the Forbes 2000, and has assets of USD 13.45 billion. All the bank's branches have been networked with its 6909 ATMs as on 30 September 2015. the Technical Analyses of the Union Bank Of India is given below RSI (?) RSI is 53.8. According to RSI analysis, unionbank is marginally strong. MACD (?) MACD: 0.5 and Signal Line: 0.765. According to MACD analysis, unionbank is marginally weak. Simple Moving Average (?) Price just got above it's 20-day simple moving average which is a positive signal. According to simple moving average analysis, unionbank is in a strong uptrend. Major support levels are 147.9975, 141.356, 136.7765. Exponential Moving Average (?) According to exponential moving average analysis, unionbank is in a strong uptrend. Major support levels are 146.5881, 144.3578, 140.4659. Bollinger Bands (?) %b is 0.521. Fibonacci Retracement (?) According to fibonacci retracement, price is above 61.8% and 50% level. Support is at 146.15 and 139.9314. Resistance level is 152.3686. Average True Range (?) ATR: 4.87 Average Directional Index (?) ADX is 14.2 which means UNIONBANK is in a trading range and there is no trend. Union bank of India Technical Analyses Volume Chart 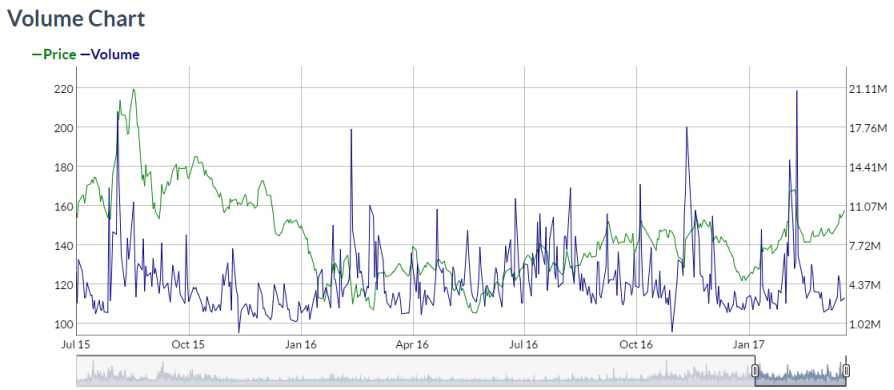 |